Below is our Real Estate Market Update compiled from Michael Orr’s ASU Monthly Housing Report, ARMLS STAT and The Arizona Republic. This data is typically 45 days behind current market conditions. I hope you find this data and information valuable!
August Stats from ARMLS
· New Listings: In August 9,807 new listings were added compared to 9,597 last year at this time, a 2.2% increase.
· Inventory: The total number of listings for sale was 6.6% higher in August than July. July reported 20,049 total Active listings and we begin September with 21,382.
· Home Sales: The August sales volume was 6.9% lower than last year, at 7,055 compared to 7,575. Month-over-month numbers were down 14.1%.
· August’s median new list price was $199,900 which is a 25% increase year over year! The average list price of $274,600 is a 23.7% increase year over year!
· August median sales price fell in August by 2.6% to $180,200, down from the median in July of $185,000. The year-over-year median sales price is 23.4% higher than this time last year.
· Foreclosures pending dropped again in August to 6,881, falling 58% year over year!!
· Distressed sales total (short sales plus lender owned sales) 1,360 which represented 19.3% of total sales…about back to normal!
From the PPI Supplement (source ARMLS)…shows the Price Points where most contacts are being written:
The following data is from ASU W.P. Carey School of Business with Michael Orr, Director Center of Real Estate Practice and Theory
Supply
The number of active single family listings without an existing contract was 11,907 for the Greater Phoenix area as of August 1. This is up 6.5% since July 1. However more than 84% of this supply is priced above $150,000 and 21% is priced over $500,000, so the shortage remains severe in the lower price ranges. The inventory of single family homes under $150,000 that have no existing signed contract has risen to 28 days from 26 days last month, mainly due to a fall in the monthly sales rate for these lower priced homes.
The mid-range between $150,000 and $500,000 is where almost all the growth in active listings is taking place. We normally see growth in active listings between August and December each year. So far this year we have 2% more listings created than at the same point in 2012, giving buyers just a little more to choose from.
Price Per SQ FT continues upward in all categories!!!
The Trend Line is going strongly in the right direction!
$122 per Sq.Ft. which get us back to September 2004 Pricing!
The following table shows the cities by the percentage increase in the annual average price per sq. ft. over the last 12 months. The average for the period Aug 2012 to Jul 2013 is compared with the average for the period Aug 2011 to Jul 2012).
Normal Re-Sales
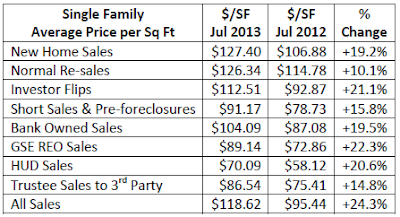
· Normal single family re-sales grew an astonishing 79% from 3,127 in July 2012 to 5,609 in July 2013. Pricing recovery for normal re-sales occurred later than for other sectors, but they have now joined in the overall price increases. The average sales price is up 9%, the median sales price is up 20% and average price per sq. ft. is up 10% over the year. Normal re-sales have increased their market share to 63% from 36% a year ago and are now by far the most numerous type of sale.
Out of State Purchasers
· The percentage of residences in Maricopa County sold to owners from outside Arizona was only 18% in July 2013 by unit count, 3% lower than June. This is the lowest percentage since February 2009. Californians dropped their market share from 5.3% to 4.2% over the last month but retained their normal position as the largest group of out of state buyers. Canadians fell from 2.2% to 1.9% to retain second place. This is the lowest percentage for Canadians since November 2007. Washington, Colorado and Illinois were the next most numerous locations for home buyers in July, all unchanged in ranking from the previous five months.
Change is in the air!!
There are several factors which are pushing the market away from extremes and back towards normality and balance:
• Demand is falling to be more balanced with the low supply
• Investors represent a falling share of the market
• Owner-occupiers are gaining market share
• Arizona residents are gaining market share
• Financed transactions are gradually replacing cash transactions
• Supply is gradually rising
All these means is that when the lull in pricing between June and September finishes, prices are likely to rise at a less furious pace than we have witnessed over the last 2 years. This will allow appraisers to catch up with the increase in average sales price per sq. ft. that we have experienced since January. This will also help financed buyers and improve their competitiveness versus cash buyers. We have been through enormous turbulence since 2002 and it will be a relief for many to be operating in a normal, healthy market. We are not there yet, but the direction is now becoming clear.
Give us a call today for more details…or to buyer or sell a home! 480-240-9724 ext. 1 or email us @ info@azexp.com


Leave a Reply